Learning Analytics
 I have extensive experience with reporting and data analysis including advanced Excel (formulas, pivot tables, macros etc.), T-SQL, Google Analytics and PowerBI. Below are a couple examples of learning dashboards I have created.
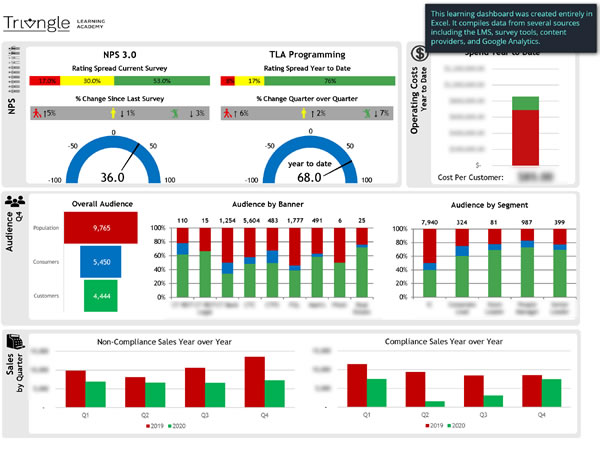
The Triangle Learning Academy Governing Council Dashboard was built in Excel and compiled data from numerous sources including Cornerstone OnDemand, Google Analytics, Survey Monkey, QuickTapSurvey, Harvard Business Publishing School and LinkedIn Learning.
The initial dashboard required nearly 4 hours of effort in Excel to collate and process the data. Through advanced Excel macros I was able to reduce this time to under 5 minutes and drastically increase accuracy by removing manual interventions. A Google Analytics dashboard was also created to measure traffic and beheaviour on our learning management system.
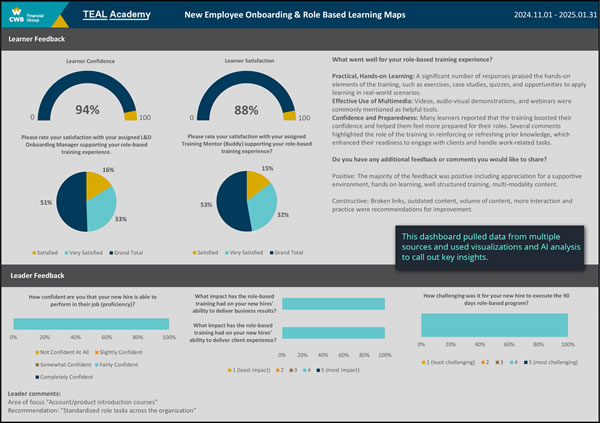 The Teal Academy Onboarding and Role Based Training Dashboard also leveraged data from multiple sources. In addition, GPT-4o AI was leverage to analyze and summarize feedback and learner sentiment.